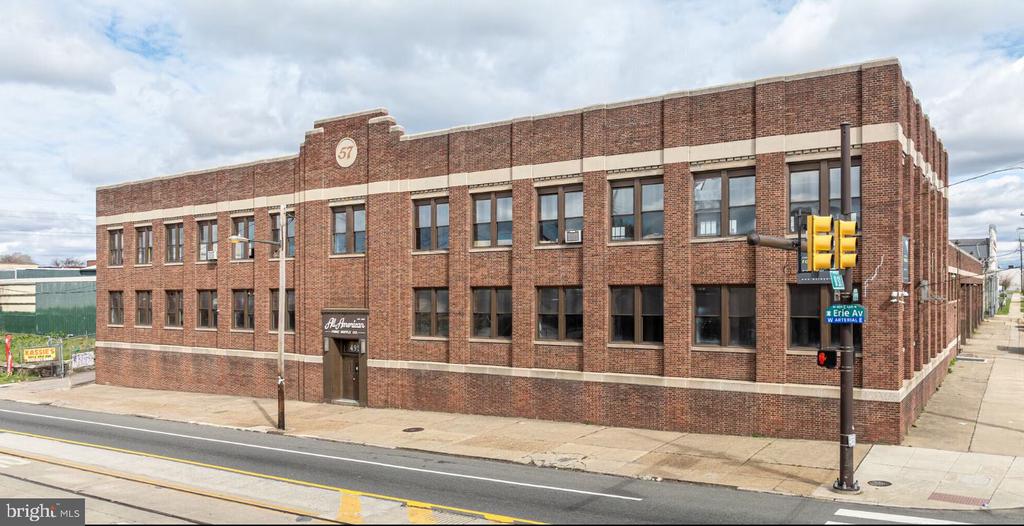
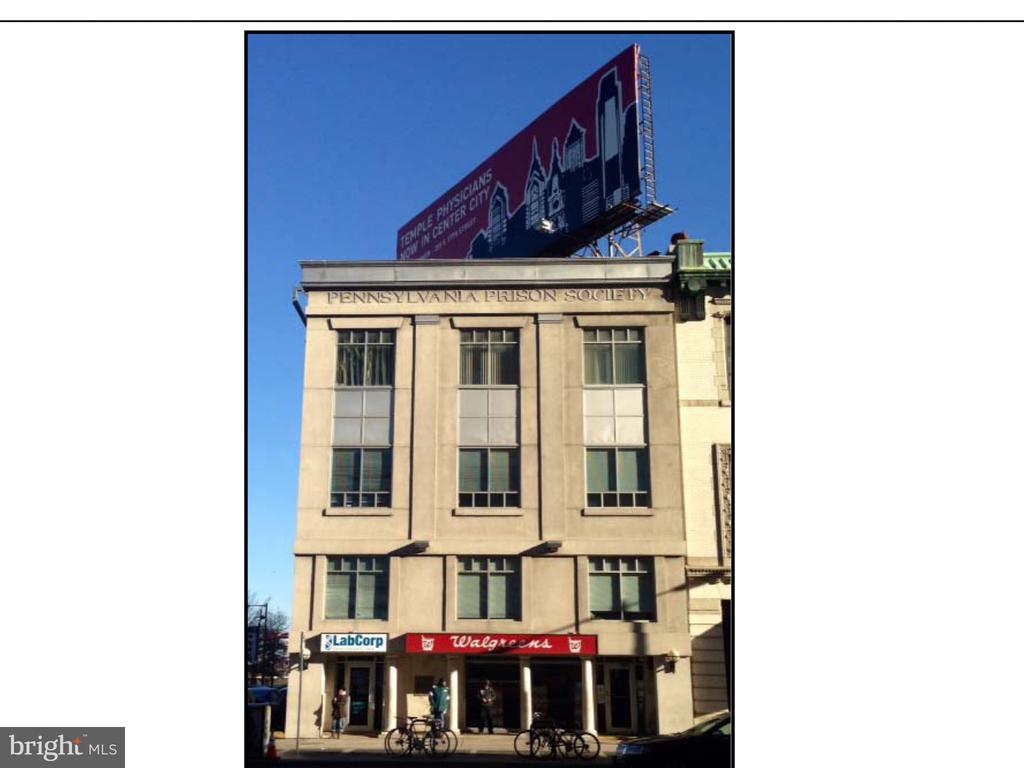
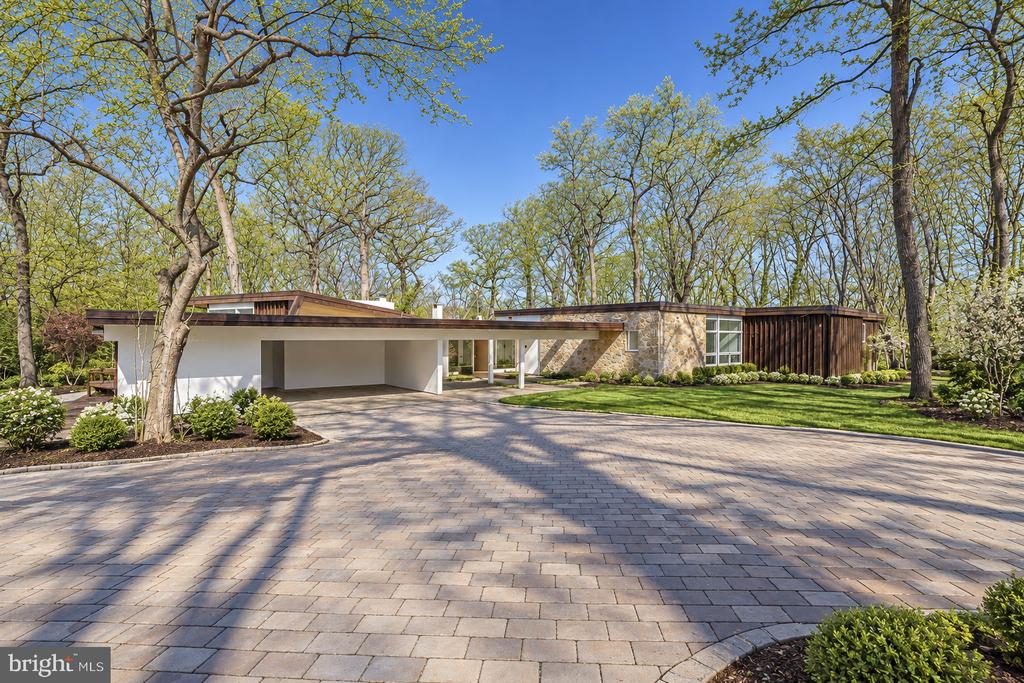
Offices:
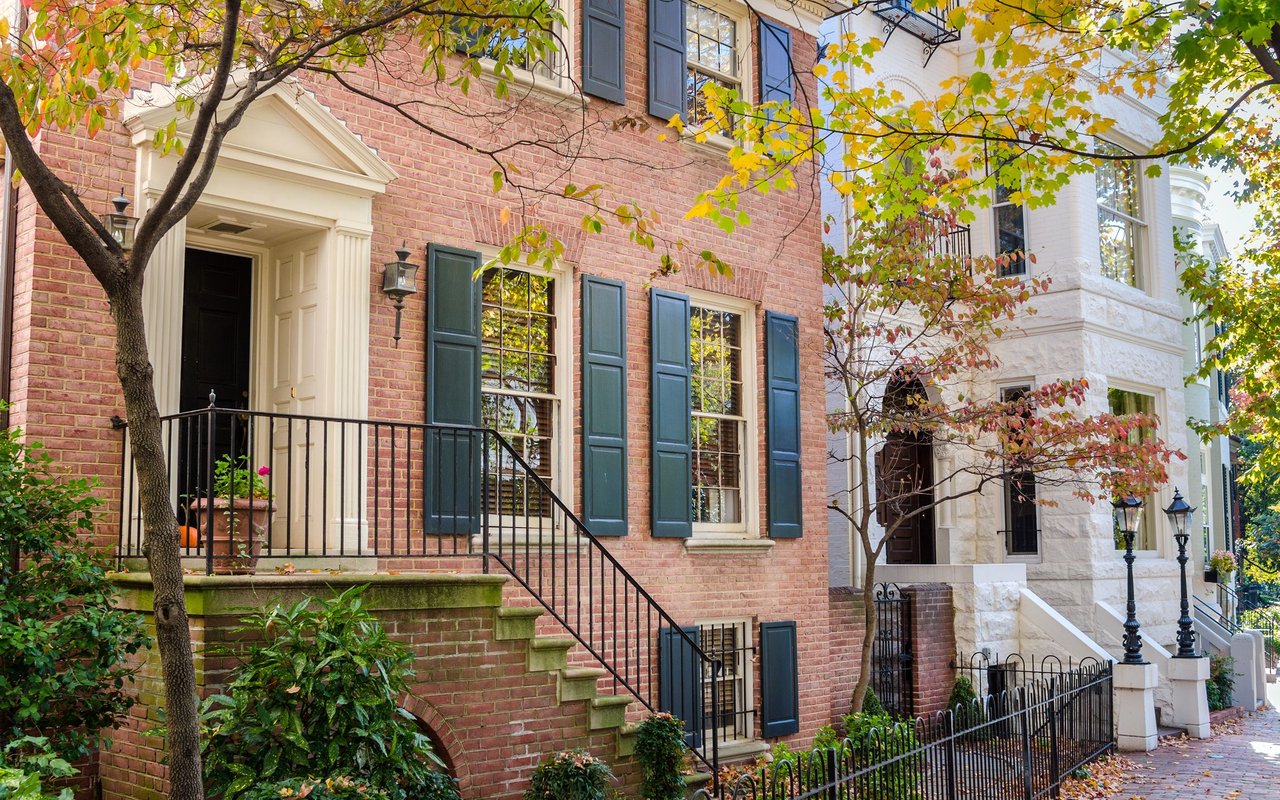
Welcome to
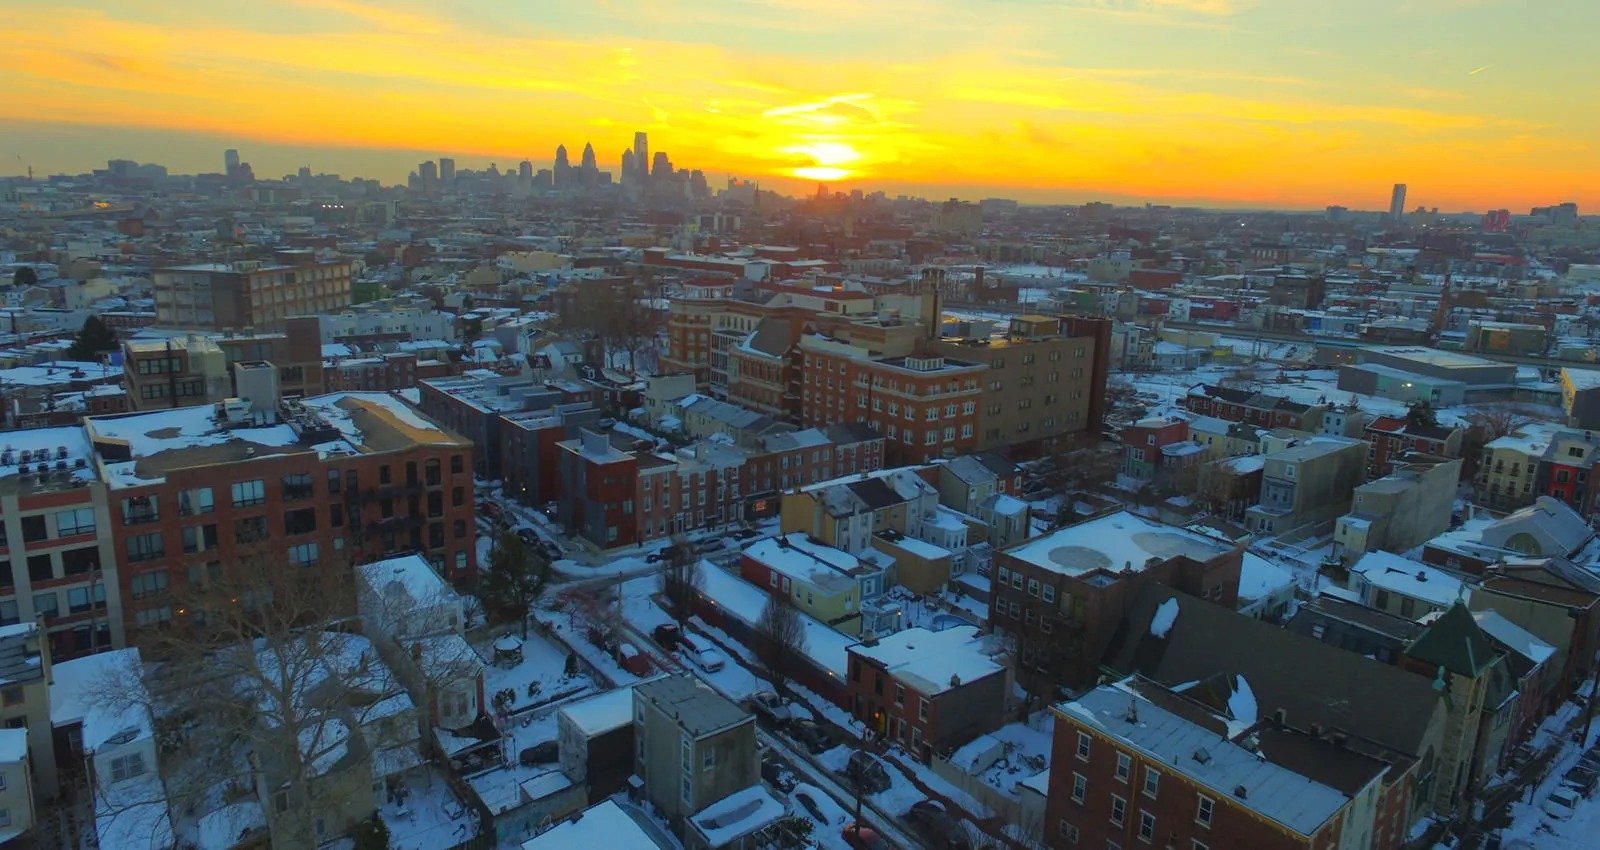
Fishtown
Most long-time residents trace their ancestry to Irish, German, and Polish Catholic immigrants.
The area was originally inhabited by members of the Turtle Clan of the Lenni Lenape Indian tribe (who the Europeans named the Delaware Indian Tribe). The first European settlers were a group of six Swedish farming families, later replaced by British landed gentry, then British shipbuilders and German fishermen.
Within a few generations there was another influx of German immigrants, then still later in the late 19th century Polish and Irish Catholic immigrants. The three Roman Catholic Churches, St. Laurentius, Holy Name of Jesus and the Immaculate Conception were built by these immigrants. Saint Laurentius, built by the Polish immigrants, and Holy Name and the Immaculate Conception, built by predominantly Irish immigrants, continue to serve the community.
The neighborhood has been working class for centuries. While poverty grew after jobs left in the de-industrialization which afflicted many "rust belt" cities, Fish town’s workers continued to maintain a stable working-class community. Most long-time residents trace their ancestry to Irish, German, and Polish Catholic immigrants. In recent years Fish town has experienced moderate gentrification characterized by significant rises in housing prices and the opening of upscale art, entertainment, and dining establishments. An influx of artists and professionals has joined the ranks of police officers, fire fighters, nurses, carpenters, electricians, stonemasons, plumbers, sheet-metal workers, and teamsters. The neighborhood was chosen by the state of Pennsylvania to be the site of the Sugar house Casino gaming complex on Delaware Avenue near Frankfort Avenue.
This choice deeply divided the neighborhood, causing conflict between those who believe it will bring jobs and economic development and those who believe it will lead to increased crime, addiction, and other social problems which negatively impact on quality of life. A Community Benefits Agreement was reached between Sugar house Casino and the membership of Fish town Action and the New Kensington CDC, which will provide money for community projects that would not otherwise be available to the residents. The George Chandler School, Green Tree Tavern, and Penn Treaty Junior High School are listed on the National Register of Historic Places. Today Fish town is home to many famous restaurants. The more well known restaurants that are popular amongst the locals include the Fish town Market, Loco Pez, Primo’s, Kraft work, Johnny Brenda's and Ida Maes Bruncherie.
13,406 people live in Fishtown, where the median age is 36 and the average individual income is $69,117. Data provided by the U.S. Census Bureau.
Total Population
Median Age
Population Density
Average individual Income
There's plenty to do around Fishtown, including shopping, dining, nightlife, parks, and more. Data provided by Walk Score and Yelp.
Explore popular things to do in the area, including DermDox Dermatology Centers.
Fishtown has 6,570 households, with an average household size of 2. Data provided by the U.S. Census Bureau. Here’s what the people living in Fishtown do for work — and how long it takes them to get there. Data provided by the U.S. Census Bureau. 13,406 people call Fishtown home. The population density is 30,807 and the largest age group is Data provided by the U.S. Census Bureau.
Total Population
Population Density Population Density This is the number of people per square mile in a neighborhood.
Median Age
Men vs Women
Population by Age Group
0-9 Years
10-17 Years
18-24 Years
25-64 Years
65-74 Years
75+ Years
Education Level
Total Households
Average Household Size
Average individual Income
Households with Children
With Children:
Without Children:
Blue vs White Collar Workers
Blue Collar:
White Collar:
Explore Other Neighborhoods
OFFICES:
OFFICES: